Abstract
Background
The estimated prevalence of eating disorders reported in community surveys from different parts of the world varies widely but there has been no systematic attempt to identify the reasons for these differences.
Objective
Use meta-analysis methods to pool data from community surveys about the prevalence of eating disorders in different locations and to identify the factors that are associated with the reported prevalence of eating disorders.
Methods
Based on pre-defined inclusion and exclusion criteria, studies were identified from the following databases: PubMed/Medline, PsycINFO, ISI web of knowledge, Ovid, Chinese National Knowledge Infrastructure, Chongqing VIP database for Chinese Technical Periodicals, WANFANG DATA, and Chinese Biological Literature Service System. Statistical analysis was conducted using R software.
Results
Among the 9315 unduplicated reports reviewed (one-fourth of which were published in Chinese) only 15 – with a pooled sample size of 72,961 individuals – met the inclusion criteria for the analysis. None of the included studies were from China and only one Asian country (South Korea) was included in the analysis. The estimated lifetime prevalence, 12-month prevalence, and 4-week prevalence of any eating disorder was 1.01% (95% confidence interval [CI], 0.54-1.89), 0.37% (CI, 0.22-0.63), and 0.21% (CI, 0.15-0.28), respectively. Estimated lifetime prevalence of anorexia nervosa, bulimia nervosa, and binge eating disorder was 0.21% (CI, 0.11-0.38), 0.81% (CI, 0.59-1.09), and 2.22% (CI, 1.78-2.76), respectively. The estimated female-male ratio for lifetime prevalence of any eating disorder was 4.2. The lifetime prevalence of any eating disorder reported from studies conducted in Western countries was 6.1-fold greater than that reported in a single study from South Korea. Over time there has been a non-significant increase in reported prevalence of any eating disorder and a significant increase in reported prevalence of anorexia nervosa.
Conclusions
Eating disorders are common in the general population, more common in women than men, and more common in Western countries than in Asian countries.The reported prevalence is increasing over time, but this may be due to changes in diagnostic criteria. There are serious limitations in the available epidemiological data, primarily differences in the conditions included among eating disorders and the lack of acceptable epidemiological studies from low- and middle-income countries (including China).
1. Introduction
Eating disorders are common conditions that have gained increasing attention over the last two decades. A growing body of literature has demonstrated their association with decreased quality oflife,[1] substantial disease burden,[2],[3] and an increased risk of depression, substance abuse and suicide.[4]–[7] Both the types of conditions included in this category of disorders and the diagnostic criteria for the specific disorders have changed over time: ‘anorexia nervosa’ (AN) and ‘bulimia nervosa’ (BN) – the most important types of eating disorders – are included in all diagnostic classifications of eating disorders, but the American Psychiatric Association Diagnostic and Statistical Manual of Mental Disorders (DSM)[8],[9] also includes ‘binge eating disorder’ (BED) and ‘eating disorder not otherwise specified’; the International Classification of Diseases (ICD)[10] also includes ‘atypical anorexia nervosa’, ‘atypical bulimia nervosa’ and several other eating disorders; and the Chinese Classification and Diagnostic Criteria of Mental Disorders (CCMD)[11] also includes ‘psychogenia nervosa’ (pathological vomiting) and some other eating disorders.
The prevalence of these conditions is rising in many countries[12],[13] and is typically higher in young females[14]–[16] and in high-income countries,[17],[18] possibly due to cultural and economic factors. There is an 18-fold difference in the reported overall prevalence of eating disorders in the general population; estimates range from 0.2%[19] to 3.7%[20] in community-based surveys. But there has been little systematic research focused on understanding the reasons for such large variations in prevalence. To address this issue, the current study uses meta-analysis methods to pool data from community surveys from around the world and analyzes these pooled data to estimate the global prevalence of these conditions and to identify factors that may help explain the large differences in reported prevalence.
2. Methods
2.1. Data retrieval strategies
The process of identifying articles for inclusion in the analysis is shown in Figure 1. The following key words (in both English and Chinese) were used to search PubMed/Medline (1966-2013), PsycINFO (1966-2013), ISI web of knowledge (1994-2013), Ovid (1970-2013), Chinese National Knowledge Infrastructure (1979-2013), Chongqing VIP database for Chinese Technical Periodicals (1989-2013), WANFANG DATA (1990-2013), and China BioMedical Literature Services System (SinoMed)(1978-2013): ‘eating disorders’, ‘anorexia nervosa’, ‘bulimia nervosa’, ‘prevalence’, and ‘epidemiology’. All articles published before April 30, 2013 were included in the search.
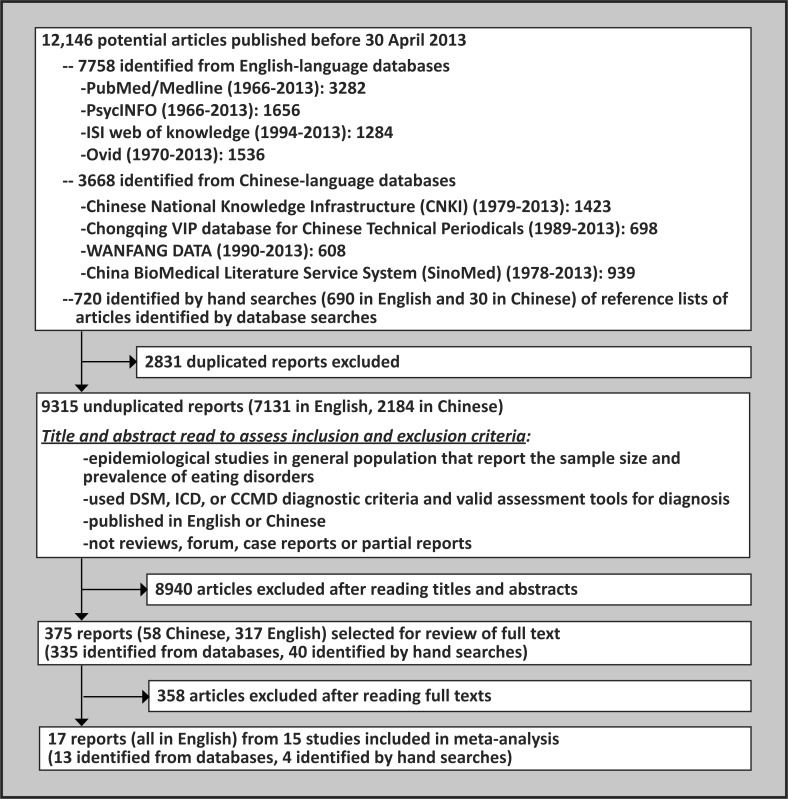
After removal of duplicates using Endnote X5 software, two authors (QJ and HQ) evaluated all articles independently. Full-text of articles were downloaded when either the reviewers believed the title or abstract of the article met inclusion criteria or when there was no clear indication whether or not the article met the inclusion criteria. The reference lists of 720 articles were hand-checked to identify any other potential articles that had not been identified during the screening of databases. These two authors then read the full-text articles and screened them according to pre-defined inclusion and exclusion criteria. A third author (WY) was consulted when these two authors disagreed about an article, which occurred for 10 of the 375 full-text articles reviewed.
2.2. Inclusion and exclusion criteria
All studies included in this meta-analysis (a) were epidemiological studies about the prevalence of eating disorders in the general population; (b) used DSM, ICD, or CCMD diagnostic criteria; (c) used validated assessment tools (primarily the Composite International Diagnostic Interview [CIDI] or the Schedules for Clinical Assessment in Neuropsychiatry [SCAN]); (d) had information about prevalence and sample size; and (e) were written in English or Chinese. Articles were excluded if they were reviews, case reports, duplicated studies, non-human studies, conducted in specific subgroups of the general population (e.g., females, students, adolescents), or conducted in special settings (e.g., hospitals, military bases).
2.3. Data extraction
Two authors (QJ and HQ) independently extracted relevant information from identified studies including the name of the first author, the year of publication, the year(s) the study was conducted, location of the survey, sampling methods, total sample size, total number of cases, and the prevalence (lifetime, 12-month, and 4-week) of eating disorders for the total sample and for different demographic subgroups.
2.4. Evaluation of the quality of reports on the studies
Two authors rated the title, abstract, methods, results, discussion, and other parts of each included study according to 22 standard items listed in the Strengthening the Reporting of Observational Studies in Epidemiology, (STROBE).[21] The range of the total score was zero to 22 with each item counting for one point. The inter-rater reliability of the two authors for this quality measure was high (intraclass correlation coefficient [ICC], 0.92).
2.5. Statistical analysis
The data were entered into a database and analyzed using the ‘Metaprop’ package in R-2.15.2 statistical software. Prevalence was logit transformed to generate pooled estimates.[22] The I2 statistic (variation in effect size attributable to heterogeneity) was calculated to assess heterogeneity across studies. Studies were considered homogeneous when I2 was less than 50% and p>0.10, in which case a fixed effect model was used to generate pooled estimates; otherwise, the random-effect model was used.[23] When there was heterogeneity, sensitivity analysis and sub-group analysis were conducted to explore the source of heterogeneity. Begg’s rank method was used to assess publication bias.[24]
3. Results
As shown in Figure 1, a total of 9315 unduplicated studies were identified, including 2184 (23.4%) reported in Chinese. All of the Chinese studies were conducted in specific subgroups of the population (e.g., students), not in the general population, so none of them were selected for inclusion in the systematic review and meta-analysis. Seventeen reports meet the inclusion criteria; three of the reports were based on the same sample (Well,[25] Browne,[26] and Browne[27]), so data from 15 separate studies were included in the analysis.
3.1. General characteristics of included studies
The characteristics of the 15 included studies are shown in Table 1. Two were conducted in the United States,[30],[37] two in Latin America,[35],[38] six in Western Europe,[20],[31]–[34],[36] three in South Korea,[19],[28],[29] one in New Zealand,[25]–[27] and one study covered 14 countries from different regions of the world.[39] These studies were conducted between 1984 and 2009 with a cumulative sample of 72,961 individuals who were at least 15 years of age. Nine studies reported results for anorexia nervosa [AN],[19],[20],[25]–[29],[31],[33],[35],[37] nine reported results for bulimia nervosa [BN],[19],[20],[25]–[27],[30],[31],[33],[35],[37],[39] eight for the general category of ‘eating disorder’ [ED],[19],[20],[25]–[27],[31]–[34],[36] and four for binge eating disorder [BED].[20],[37]–[39] Except for two studies which used ICD-10 diagnostic criteria,[34],[35] all others used DSM diagnostic criteria.
Table 1.
| Study | Country (region) | Year(s) study conducted | Sampling methoda | Diagnostic criteriab | Sample size | Diagnoses consideredc | Number of cases in different time intervals
|
||
| lifetime | prior 12 months | prior 4 weeks | |||||||
| Lee 1990(A)[28] | South Korea (Seoul) | 1984 | C,M,R | DSM-III | 3134 | AN | 1 | — | — |
| Lee 1990(B)[29] | South Korea (rural areas) | 1984 | C,M,R | DSM-III | 1966 | AN | 0 | — | — |
| Rand 1992[30] | United States (Florida) | 1984-1985 | R,M | DSM-III | 2115 | BN | 23 | — | — |
| Bijl 1998[31] | Netherlands | 1996 | M,S,R | DSM-III-R | 7076 | EDd | 49 | 27 | 18 |
| AN | 7 | 0 | 0 | ||||||
| BN | 42 | 27 | 18 | ||||||
| Kringlen 2001[32] | Norway (Oslo) | 1994-1997 | R | DSM-III-R | 2066 | EDd | 37 | 14 | — |
| Meyer 2001[33] | Germany | 1996-1997 | R | DSM-IV | 4075 | EDd | 28 | 7 | 3 |
| AN | 4 | 0 | 0 | ||||||
| BN | 2 | 0 | 0 | ||||||
| Roca-Bennasar 2001[34] | Spain (Formentera) | 1999 | S,M | ICD-10 | 697 | EDd | — | — | 13 |
| Andrade 2002[35] | Brazil (São Paulo) | 1994-1995 | S,M, | ICD-10 | 1464 | AN | 0 | 0 | 0 |
| BN | 22 | 15 | 10 | ||||||
| Jacobi 2004[36] | Germany | 1998-1999 | M,R,S | DSM-IV | 4181 | EDd | 33 | 14 | 8 |
| Well 2006e,[25] | New Zealand | 2003-2004 | M,S | DSM- IV | 7435 | EDd | 129 | 36 | 15 |
| Browne 2006e,[26] | AN | 45 | <7 | — | |||||
| Browne 2006e,[27] | BN | 95 | 31 | — | |||||
| Cho 2007[19] | South Korea | 2001 | M,C,R | DSM- IV | 6275 | EDd | 13 | 3 | — |
| AN | 10 | 3 | — | ||||||
| BN | 3 | 0 | — | ||||||
| Hudson 2007[37] | United States | 2001-2003 | R,M,C | DSM- IV | 2980 | AN | 19 | 0 | — |
| BN | 32 | 9 | — | ||||||
| BED | 85 | 37 | — | ||||||
| Preti 2009[20] | 6 Western European countriesf | 2001-2003 | S,M,C | DSM- IV | 4139 | EDd | 155 | 44 | — — — |
| AN | 22 | 1 | |||||||
| BN | 46 | 11 | |||||||
| BED | 77 | 28 | |||||||
| Swanon 2012[38] | Mexico | 2001-2003 | S,M,R | DSM- IV | 1234 | BED | 32 | — | — |
| Kessler 2013[39] | 14 countriesg | 2001-2009 | S,M,C | DSM- IV | 24,124 | BN | 241 | 96 | — |
| BED | 458 | 193 | — | ||||||
a R, random sampling; C, clustered sampling; S, stratified sampling; M, multi-stage sampling
b DSM, Diagnostic and Statistical Manual; ICD, International Classification of Diseases
c ED, eating disorders; AN, anorexia nervosa; BN, bulimia nervosa; BED, binge eating disorder
d ED is defined as the sum of AN and BN in four studies,[19],[25]–[27],[31],[32] as the sum of AN,BN and other atypical eating disorders in three studies,[20],[33],[36] and is not clearly defined on one study[34]
e The three reports on the study from New Zealand only provided rates so the numbers of cases are estimated multiplying the reported rates by the reported sample size
f 6 European countries: Belgium, France, Germany, Italy, Netherlands and Spain
g Countries participating in WHO World Mental Health Survey: Colombia, Brazil, Mexico, Romania, Belgium, France, Germany, Italy, Netherlands, New Zealand, Northern Ireland, Portugal, Spain and United States
3.2. Evaluation of study quality and assessment of publication bias
The mean (sd) quality score for the reports of the studies based on the STROBE items was 20.3 (1.8) and the range in this score varied from 16.5[28] to 22.0.[19],[20],[31],[35],[36] The most common problems in the reports of these 15 studies were inadequate description of the sample characteristics (10 studies), of the statistical methods (6 studies), and of the methods for determining the sample size (4 studies).
Begg’s adjusted rank correlation test found evidence of publication bias for reports of the lifetime prevalence of ED (Z=2.40, p=0.016) and for reports of the lifetime prevalence of AN (Z=2.10, p=0.035); studies with smaller samples had higher reported prevalence. There was no statistically significant publication bias in reports of the lifetime prevalence of BN (Z=0.10, p=0.917) or in the 12-month prevalence of ED (Z=1.50, p=0.133), AN (Z=0.00, p=1.000) or BN (Z=0.00, p=1.000). There were not enough reports of the 4-week prevalence of these conditions or of the prevalence of BED to assess publication bias.
3.3. Assessment of heterogeneity and sensitivity analysis
As shown in Table 2, several of the prevalence estimates were based on studies that were quite heterogeneous and, thus, the estimated pooled prevalence was based on using random-effect models. We conducted sensitivity analysis to identify outlier studies that adversely affected the homogeneity of the results. Only one such study was identified. The high level of heterogeneity found in the five studies that reported 4-week prevalence of ED (I2=93.7%, p<0.001) was substantially reduced after removal of the Roca-Bennasar study,[34] a small study (n=697) conducted on a small island in Spain; the remaining four studies had sample sizes greater than 4000 and were national studies that were quite homogeneous (I2=25.6%, p=0.259).
Table 2.
| number of studies | n | number of cases | I2 (p-value) | prevalence (%) | 95% CI | Q-value (p-value) | |
| EATING DISORDER | |||||||
| Lifetime prevalence | 7 | 35,247 | 444 | 97.5 (<0.001) | (R) 1.01 | 0.54-1.89 | — |
| studies in Western countries | 6 | 28,972 | 431 | 97.2 (<0.001) | (R) 1.29 | 0.71-2.34 | 19.74 |
| single study in South Korea | 1 | 6275 | 13 | — | 0.21 | 0.11-0.35 | (<0.001) |
| studies conducted 1990-1999 | 4 | 17,398 | 147 | 87.3(<0.001) | (R) 0.91 | 0.57-1.43 | 0.20 |
| studies conducted 2000-2009 | 3 | 17,849 | 297 | 98.4 (<0.001) | (R) 1.17 | 0.42-3.17 | (0.657) |
| males | 7 | 17,370 | 77 | 89.0 (<0.001) | (R) 0.38 | 0.18 -0.79 | 9.12 |
| females | 7 | 17,877 | 368 | 96.3 (<0.001) | (R) 1.59 | 0.90-2.80 | (0.003) |
| 12-month prevalence | 7 | 35,247 | 145 | 89.1 (<0.001) | (R) 0.37 | 0.22-0.63 | — |
| males | 7 | 17,370 | 33 | 50.7 (0.058) | (R) 0.22 | 0.12-0.38 | 6.26 |
| females | 7 | 17,877 | 112 | 85.9 (<0.001) | (R) 0.58 | 0.34-0.98 | (0.012) |
| 4-week prevalencea | 4 | 22,767 | 44 | 25.6 (0.259) | (F) 0.21 | 0.15-0.28 | — |
| males | 3 | 8056 | 7 | 0.0 (0.801) | (F) 0.09 | 0.04-0.19 | 5.10 |
| females | 3 | 7276 | 22 | 52.4 (0.122) | (R) 0.29 | 0.15-0.58 | (0.024) |
| ANOREXIA NERVOSA | |||||||
| Lifetime prevalence | 9 | 38,544 | 108 | 85.9 (<0.001) | (R) 0.21 | 0.11-0.38 | — |
| studies in Western countries | 5 | 25,705 | 97 | 87.4 (<0.001) | (R) 0.32 | 0.17-0.61 | 3.87 |
| studies in South Korea | 3 | 11,375 | 11 | 46.2 (0.156) | (F) 0.13 | 0.07-0.23 | (0.049) |
| studies conducted 1980-1989 studies conducted 1990-1999 | 23 | 5,100 12,615 | 111 | 0.0 (0.896) 0.0 (0.764) | (F) 0.03 (F) 0.09 | 0.01-0.15 0.05-0.17 | 22.38 |
| studies conducted 2000-2009 | 4 | 20,829 | 96 | 81.1 (0.001) | (R) 0.45 | 0.27-0.73 | (<0.001) |
| males | 9 | 18,935 | 16 | 26.2 (0.211) | (F) 0.15 | 0.10 -0.24 | 4.60 |
| females | 9 | 19,573 | 92 | 83.1 (<0.001) | (R) 0.33 | 0.18-0.62 | (0.032) |
| 12-month prevalence | 6 | 26,009 | 4 | 0 (0.804) | (F) 0.03 | 0.01-0.06 | — |
| males | 6 | 12,921 | 0 | 0 (—) | — | — | — |
| females | 6 | 13,052 | 4 | 0 (0.726) | (F) 0.06 | 0.03-0.13 | |
| 4-week prevalence | 3 | 12,615 | 0 | 0 (—) | — | — | — |
| males | 3 | 6435 | 0 | 0 (—) | — | — | — |
| females | 3 | 6180 | 0 | 0 (—) | — | — | |
| BULIMIA NERVOSA | |||||||
| Lifetime prevalence | 9 | 59,683 | 506 | 88.2 (<0.001) | (R) 0.81 | 0.59-1.09 | — |
| studies in Western countries | 7 | 44,192 | 399 | 83.6 (<0.001) | (R) 0.90 | 0.46-1.18 | 24.51 |
| studies in South Korea | 1 | 6,275 | 3 | — | 0.05 | 0.01-0.14 | (<0.001) |
| studies conducted 1980-1989 | 1 | 2115 | 23 | — | 1.09 | 0.69-1.63 | 2.19 (0.334) |
| studies conducted 1990-1999 | 3 | 12,615 | 66 | 92.8 (<0.001) | (R) 0.46 | 0.15-1.38 | |
| studies conducted 2000-2009 | 5 | 44,953 | 417 | 88.0(<0.001) | (R) 0.89 | 0.63-1.26 | |
| males | 7 | 16,886 | 37 | 54.2 (0.042) | (R) 0.27 | 0.15-0.46 | 14.53 |
| females | 7 | 17,173 | 206 | 87.4 (<0.001) | (R) 1.05 | 0.68-1.62 | (<0.001) |
| 12-month prevalence | 8 | 57,568 | 189 | 76.4 (<0.001) | (R) 0.37 | 0.25-0.54 | — |
| males | 6 | 15,989 | 19 | 40.1 (0.138) | (F) 0.18 | 0.12-0.28 | 7.72 |
| females | 6 | 15,955 | 59 | 56.1 (0.044) | (R) 0.44 | 0.28-0.69 | (0.006) |
| 4-week prevalence | 3 | 12,615 | 28 | 83.2 (0.003) | (R) 0.26 | 0.08-0.83 | — |
| males | 2 | 5953 | 4 | 0 (0.340) | (F) 0.09 | 0.03-0.22 | 0.12 |
| females | 2 | 5198 | 14 | 75.2 (0.046) | (R) 0.15 | 0.01-2.24 | (0.730) |
| BINGE EATING DISORDER | |||||||
| Lifetime prevalence | 4 | 32,477 | 652 | 79.6 (0.002) | (R) 2.22 | 1.78-2.76 | — |
| males | 2 | 2962 | 36 | 88.8 (0.003) | (R) 1.19 | 0.42-3.29 | 2.03 |
| females | 2 | 4157 | 105 | 0 (0.490) | (F) 2.53 | 2.09-3.06 | (0.154) |
| 12-month prevalence | 3 | 31,243 | 258 | 73.3 (0.024) | (R) 0.87 | 0.65-1.18 | — |
| males | 2 | 2962 | 14 | 78.5 (0.031) | (R) 0.46 | 0.03-1.58 | 2.23 |
| females | 2 | 4157 | 51 | 57.3 (0.126) | (R) 1.25 | 0.82-1.89 | (0.135) |
I2, heterogeneity coefficient (proportion of variance in results due to heterogeneity of included studies); CI, confidence interval; (R), computed using random-effects model; (F), computed using fixed-effects model; Q-value, the value of the test for subgroups differences.
a This excludes the small study from Spain[34] because its inclusion significantly increased the heterogeneity of the results
3.4. Prevalence of eating disorders
The estimated prevalence of the different conditions are shown in Table 2 and in Figures 2 to to4.4. Summarized from seven studies, the lifetime and 12-month prevalence of ED in the pooled sample of 35,247 individuals was 1.01% (95% CI=0.54-1.89) and 0.37% (95% CI=0.22-0.63), respectively. After excluding one of the five studies that reported 4-week prevalence due to high heterogeneity, the 4-week prevalence of ED in the pooled cumulative sample in the remaining four studies of 22,767 individuals was 0.21% (95% CI=0.15-0.28).
For specific types of eating disorders, the highest lifetime prevalence was found for BED (2.22%), followed by BN (0.81%) and AN (0.21%); the 12-month prevalence was also highest in BED (0.87%), followed by BN (0.37%) and AN (0.03%). None of the studies reported 4-week prevalence of BED; pooling results from three studies,[31],[33],[35] the 4-week prevalence of BN was 0.26%; and the three studies that reported 4-week prevalence of AN[31],[33],[35] all reported a prevalence of zero.
3.5. Subgroup analysis
As shown in Table 2, among females, the lifetime, 12-month, and 4-week prevalence of ED was 4.2-, 2.6-, and 3.2-fold the corresponding prevalence in males, respectively. Similarly, the lifetime prevalence of AN, BN and BED in females were 2.2-, 3.9-, and 2.1-fold the corresponding prevalence in males. With the exception of the lifetime prevalence of BED (which was only reported by gender in two relatively small studies) all these gender ratios were statistically significant (i.e., greater than 1).
The reported prevalence of different eating disorders varied by geographic regions. We pooled data from high-income countries in Western Europe (Netherlands,[31] Norway,[32] Germany,[33],[36] and the six-nation Western European study[20]), from the United States,[30],[37] from New Zealand,[25]–[27] and from the 10 western countries included in the WHO global study[39] to estimate the pooled prevalence of the different eating disorders for ‘Western countries’. Data from the three studies in South Korea[19],[28],[29] were pooled to estimate the pooled prevalence in Asia. As shown in the table, the lifetime prevalence of ED from six studies in Western European countries and New Zealand was 6.1-fold higher than the prevalence in the single study from Asia (South Korea) that reported lifetime prevalence of ED (1.29% v. 0.21%). The lifetime prevalence of AN reported in five studies from Western Europe, New Zealand and the United States was 2.5-fold that reported in three studies from South Korea (0.32% v. 0.13%). And the lifetime prevalence of BN in seven studies from Western Europe, New Zealand and the United States was 18-fold that reported from a single study in South Korea (0.90% v. 0.05%). None of the South Korean studies reported the prevalence of BED, so it was not possible to make regional comparisons of the prevalence of BED.
There was also some variation in prevalence by the time the studies were conducted with a general trend of increasing prevalence over time. The pooled lifetime prevalence of ED reported in three studies conducted from 2000 to 2009 was 29% higher that the prevalence reported in four studies conducted from 1990 to 1999 (1.17% v. 0.91%, p=0.657). The pooled lifetime prevalence of AN in four studies conducted from 2000 to 2009 was 5.0-fold higher than the pooled prevalence in three studies conducted from 1990 to 1999 and this prevalence was, in turn, 3.0-fold higher than the pooled prevalence in two studies conducted from 1980 to 1989(0.45% v. 0.09% v. 0.03%, respectively; p<0.001). However, the prevalence of BN did not show a clear increasing pattern over time; the lifetime prevalence of BN from one study conducted from 1980-1989 was 1.09%, the pooled prevalence of three studies conducted from 1990 to 1999 was 0.46%, and the pooled prevalence of four studies conducted from 2000 to 2009 was 0.89% (p=0.334).
Only one study [25] (from New Zealand) reported the prevalence in different age groups. This study found lifetime prevalence of ED of 2.0%, 2.9%, 1.0% and 0.1% for individuals who were, respectively, 16 to 24 years of age, 25 to 44 years of age, 45 to 64 years of age, and 65 years of age or older. For AN and BN, both lifetime and 12-month prevalence in individuals 16 to 24 years of age and 25 to 44 years of age were higher than the corresponding prevalence in individuals 45 to 64 years of age and 65 years of age or older.
4. Discussion
4.1. Main findings
Despite our effort to identify suitable Chinese-language publications, no studies from mainland China were included in this meta-analysis. The main reasons for failure to identify suitable studies from China are that large-scale psychiatric epidemiological surveys in China do not assess subjects for eating disorders [40],[41] and the epidemiological studies of eating disorders that are available are all conducted in population subgroups[42] (primarily students) and do not use internationally accepted diagnostic screening instruments.[43],[44] With the exception of the three studies from South Korea, we also failed to identify suitable studies from other parts of Asia or from Africa.
Results from this meta-analysis indicate that eating disorders are not rare in the general population; the prevalence of eating disorders is similar to that of impulse control disorders and illegal drug use disorder. [45] Among specific types of eating disorders, the highest prevalence was found for BED, followed by BN, and AN. This is consistent with findings from recent studies[20],[37],[46] and highlights the importance of BED, which was recently added to the group of eating disorders consider in the DSM-5.[9] This study also found an elevated prevalence of eating disorders among females which is consistent with previous findings.[47],[48]
We found a non-significant increase in the reported prevalence of ED over time and a statistically significant increase in the reported prevalence of AN over time. Other studies have also suggested that there is an increase in eating disorders over time.[13],[49] It is not possible to confirm the reasons for the increasing prevalence, but we expect that inclusion of new disorders (such as BED) in the eating disorder category and relaxation of the rigorous diagnostic criteria of AD[50] are the major reasons for increases in the reported prevalence over time.
Based on the single study that provided prevalence by age (in New Zealand), we also found a higher prevalence of eating disorders among individuals who were 16 to 44 years of age than in those who were 45 or older. This finding is consistent with previous evidence that eating disorder is more common among adolescents.[51],[52] A study among Chinese college students[43] reported a lifetime prevalence of eating disorders of 3.3% and the United States National Comorbidity Survey reported a lifetime prevalence of eating disorder of 2.7% among adolescents.[51] Clearly, prevention and intervention strategies should focus on adolescents and young adults.
The observed 6.1-fold difference in the prevalence of eating disorders between Western countries and Asian countries (representated by a single study in South Korea) is consistent with findings from earlier studies.[17],[18] Cultural discrepancies and variations in dietary habits may contribute to this difference, but only one country from Asia was included in the analysis, so the result must be considered preliminary.
4.2. Limitations
There are two main limitations to our results. First, different studies – even those that use the same diagnostic instruments – included different conditions under the broad category of ‘eating disorders’. Some studies limited ED to the combination of AN and BN; others included AN, BN and BED; some included atypical types of eating disorders; and some did not indicate which conditions were included. This variability in the included conditions is probably the main reason for the substantial heterogeneity in the prevalence of ED. The reported increase in prevalence over time may reflect diagnostic changes, not real changes in the prevalence of these conditions.
Second, the included studies were predominantly from high-income countries so it is unclear how representative these results are of the prevalence of eating disorders in low- and middle-income countries. This makes it is difficult to clarify the association between the prevalence of eating disorders and economic development. Moreover, there was only one country from Asia included in the analysis (South Korea) and this was a high-income country which may not be representative of other Asian countries. The reported lower prevalence in ‘Asia’ compared to Western countries may need to be reconsidered when new studies from Asian countries are conducted.
There were also some other limitations to the study. The quality measure developed from the STROBE assessed the quality of the report of the studies; it is not a direct measure of the quality of the data provided in the studies. Assessment of publication bias generally requires a minimum of 10 studies; the current report only had 7 to 9 studies that reported the lifetime and one-year prevalence of ED, AN, and BN, so the findings related to publication bias must be considered preliminary.
4.3. Implications
To the best of our knowledge, this is the first report that uses meta-analysis to summarize prevalence studies on eating disorders from around the world. Our results indicate that eating disorders are common in the general population and may be increasing, though the perceived increase may primarily be due to changes in diagnostic criteria. There is a clear elevated risk of these conditions in females and there may be a higher prevalence in western countries than in Asian countries. There are, however, serious limitations in the available epidemiological data, primarily the lack of consistency in the conditions included under the category of ‘eating disorders’ and the virtual absence of acceptable epidemiological studies from low- and middle-income countries (including China).
Biography
Dr. Jie Qian obtained a bachelor’s degree in clinical medicine (2007) and then received a master degree in Psychiatry and Mental Health (2010) from Tongji University School of Medicine in Shanghai. She completed her residency at the Shanghai Mental Health Center and is currently an attending physician in the clinical psychology department of the Shanghai Yangpu District Central Hospital. Her research interests include the conduct of systematic reviews and anxiety disorders.
Footnotes
Conflict of interest: Authors declare no conflict of interest related to this article.
Funding: The preparation of this report was supported by the Research Leadership Development Plan of the city of Shanghai (XBR2011005).